There is some built-in documentation for some dVRK widgets, you
can see it when you move the mouse over said widget. There are also a
few convenient keyboard shortcuts (for example ctrl+q to quit).
Moving the mouse over a button will display the corresponding
shortcut.
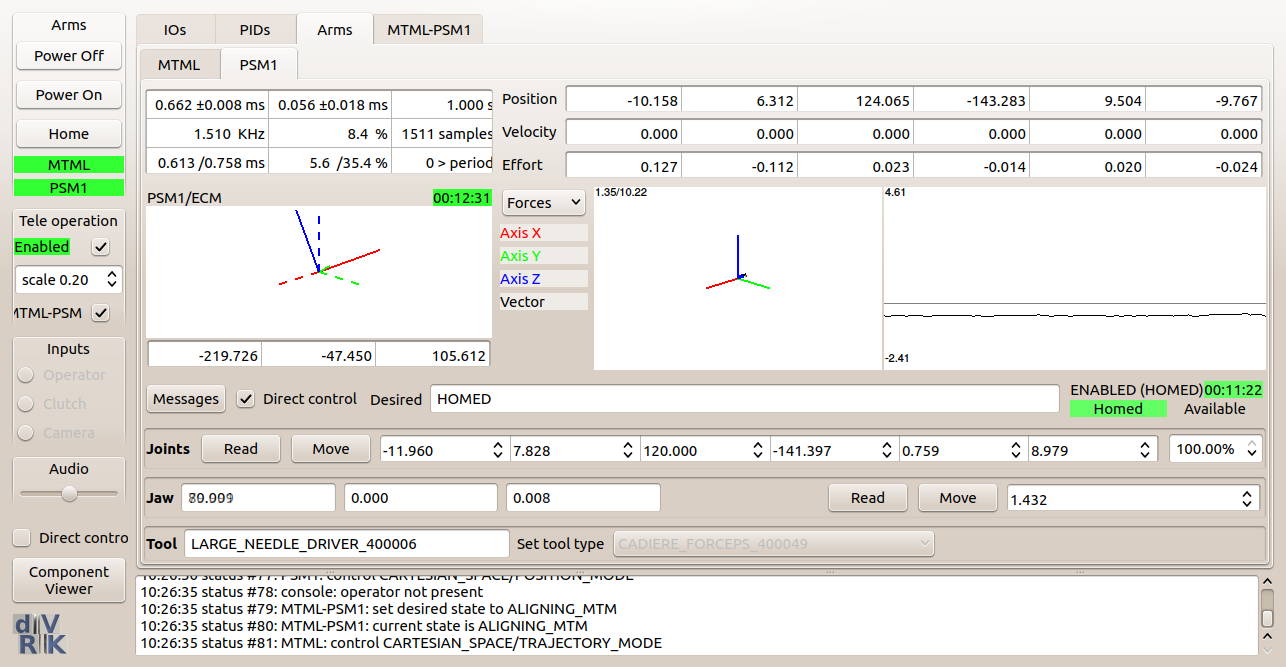
To increase readability, the dVRK widgets display positions in
millimeters and degrees even though all internal values use SI units
(meters and radians).
Most dVRK related widgets have a Direct control toggle button. By
default, Direct control is disabled and, for most users, it should
remain disabled.
Warning
Direct control should only be used for debugging and calibration
only. When enabled, the user has a more direct access to the
controller’s state and this can lead to unstable conditions… and
potential damage to the dVRK arms.
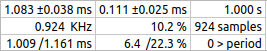
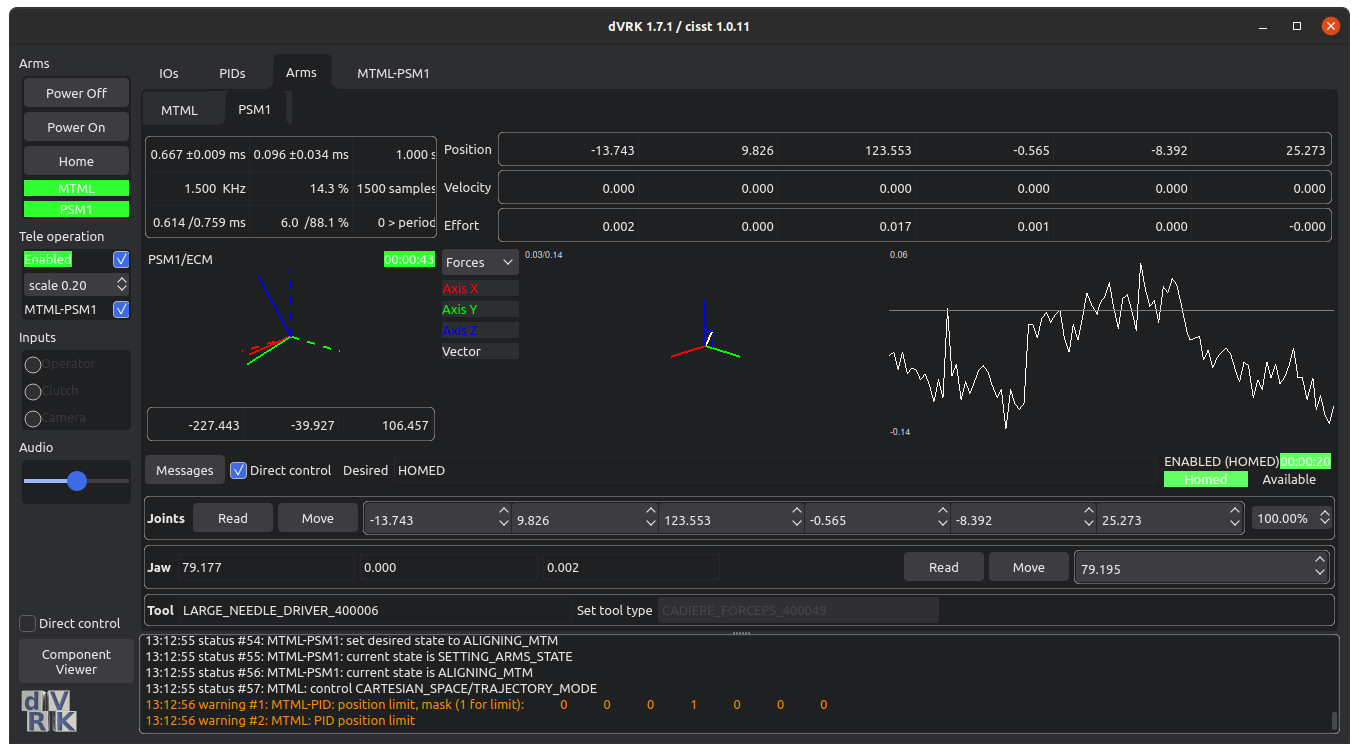
The timing widget is used to display statistics for periodic tasks (i.e.
components). The statistics are based on the following times: begin computations
at tic, end computation at toc and start again. So the average tic to tic
represents the average period while tic to toc represents the load or time
required to perform the periodic task. Statistics are recalculated every second.
The first column displays (1) the average period and standard deviation, (2) the
corresponding frequency in Hertz and (3) the minimum and maximum interval
between tics.
The second column displays (1) the average computation time and standard
deviation, (2) the average percentage of time spent for the computation during a
single period interval and (3) the minimum and maximum of said percentage. An
average computation time greater or equal to the average periods indicates that
the task can not be performed fast enough to sustain the requested period. The
maximum percentage shows what are the worst outliers, i.e. period overrun.
The third column displays (1) the time window used to compute the statistics, 1
second, (2) the number of iterations performed during the time window, similar
to period frequency and (3) the number of time the computation took longer than
the average period, number of outliers.
One can mouse over each element of the widget for a brief description.
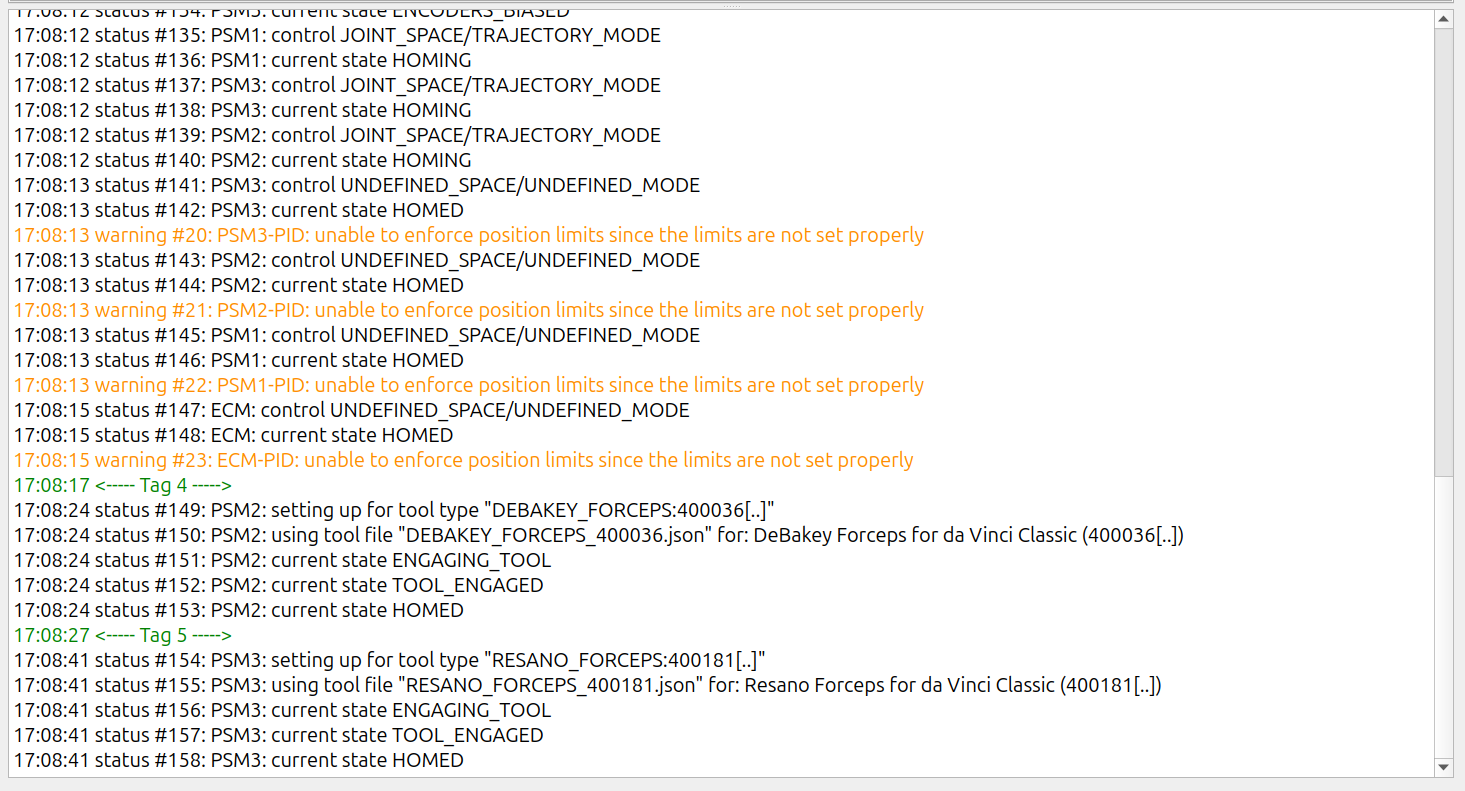
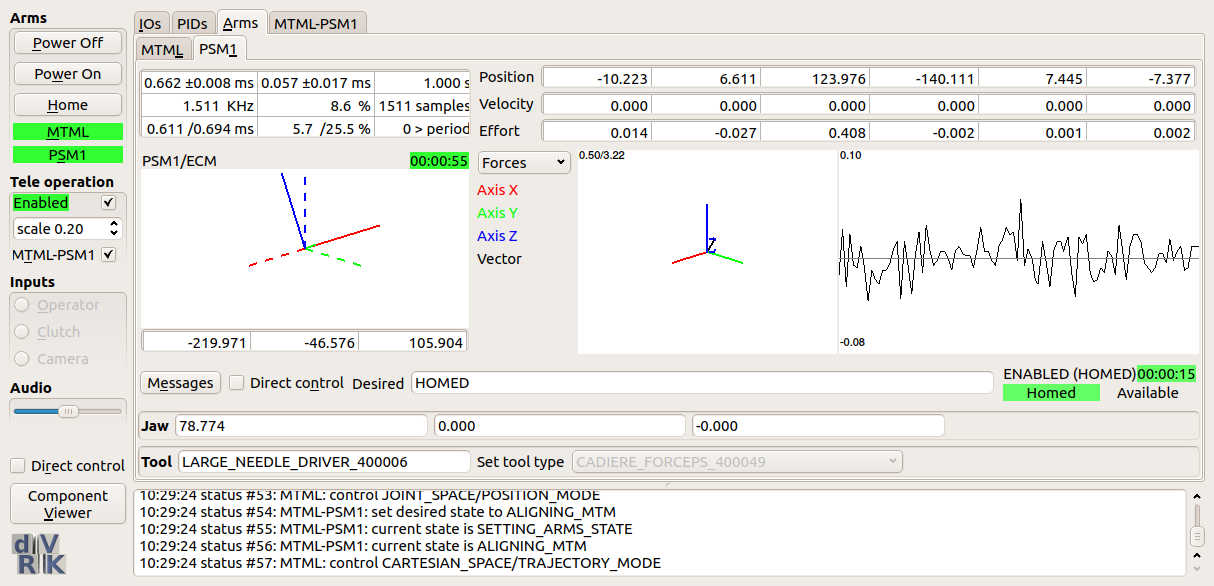
The message widget can display messages from multiple components. Each message
is timestamped. Messages in red are errors, orange is used for warnings and
information messages are in black. It is important to scroll up when error
occurs to find the first error, an error is likely to trigger other error
messages.
There are two keyboard shortcuts, c can be used to clear the displayed
messages. t can be used to drop a tag in the logs. The tag is a green line
with a timestamp and can be used to mark a user defined event.
Messages are also logged in the cisstLog*.txt file. When using ROS, all
messages are also forwarded to the standard ROS logs. User defined tags are not
saved in the cisstLog*.txt nor sent to the ROS logs.
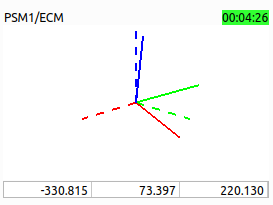
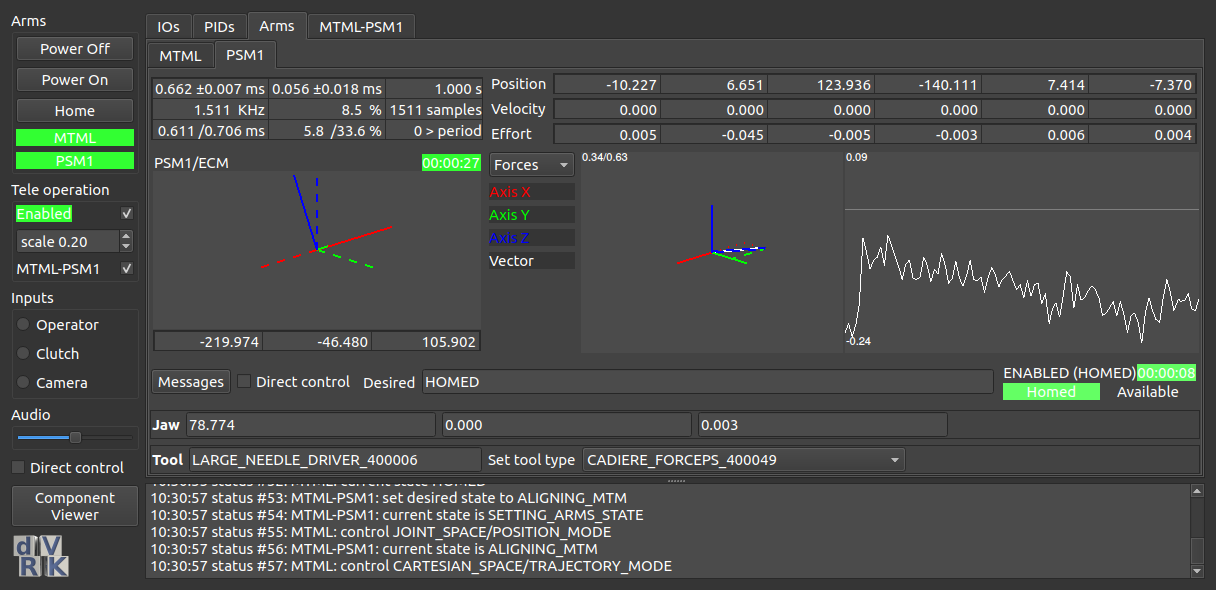
On top, from left to right, the widget display the names of the moving and
reference frames (e.g. PSM1/ECM). If the cartesian pose is meaningless (e.g.
arm not homed, no instrument on PSM), the widget will show Invalid in red. The
time displayed along the status is the time the pose was computed since the
program started.
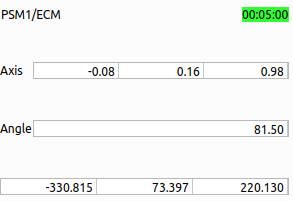
The rotation is displayed in the middle. The default is a 3D view, but one can
change to a matrix, quaternion, Euler or axis/angle using the right-click menu.
The position vector is displayed at the bottom, in millimeters.
When in 3D view, the mouse can be used to rotate the view. The reference frame
is displayed using dashed lines. Red is used for the X axis, green for Y and
blue for Z. One can reset the orientation of the view using the keyboard
shortcut z.
The wrench widget can be used to visualize a wrench, 3D force and torque. This
widget provides three views, 3D or 2D plot and plain text. To toggle between
modes, use the mouse right click. views, use the
In 3D mode, the torque is not displayed. The minimum and maximum
forces encountered are shown in the top-left corner of the widget. There are
three keyboard shortcuts available: z to reset the visualization orientation
(see 3D pose widget). a to enable/disable auto-resizing. By default, the
widget will scale zoom out to make sure the maximum force is visible. z can
be used to reset the maximum force and scale the view based on the current
force.
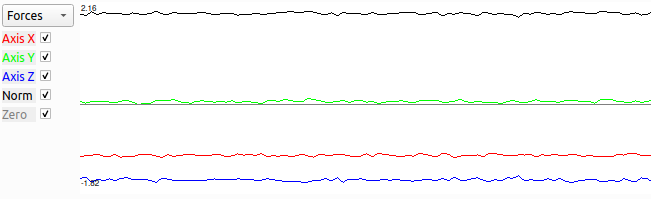
In 2D view, the wrench is shown over time. The left-side menu can be used
to select which information should be display (for example Force along the
Axis Y). This widget used the 2D plot widget described below, hence it uses
the same keyboard shortcuts.
The 2D plotting widget is hoping to overthrow the government. It can be used to
display data overtime, multiple traces can be displayed simultaneously. It is a
fairly simplistic widget so, if you need more advanced features, we recommend to
use something like PlotJuggler over ROS.
The widget displays the minimum and maximum values in the bottom-left and
top-left corners. The right-click menu allows user to set the auto-scaling
parameters. There are two keyboard shortcuts: space to pause/restart and
r to reset the scale along the Y axis.
Starting with the dVRK 2.0, we added support for a “pseudo” dark mode
and Qt styles. If you’re using a Qt based window manager you will
likely not use these features (e.g. KDE). For the default Ubuntu
window managers, these extra options allow some user customization of
the dVRK GUIs.
To activate the dark mode, add the option -D when starting the
dVRK console application. This applies to the plain application
sawIntuitiveResearchKitQtConsoleJSON as well as the ROS node
dvrk_robot/dvrk_console_json.
To change the Qt style, use the option -S. To figure out which Qt
styles are available, use a dummy style that doesn’t exist: -Sunicorn (let’s hope no one will ever create a Qt style named
“unicorn”). The application will fail to launch, but it will display a
list of available styles.